

Vetoquinol vs Zoetis
The private owner business operator vs the wall street financial machine - and why I bought the one with the lower expected returns


I planned to post this as a note but at the end decided it will be most appropriate to share as a free article.
One of the most value added exercises is to compare your potential buy with a competitor from the same industry. This can give you a competitive insight of the industry and the company.
Before continuing further I want you to understand that the insights which you will gain if you follow this approach may be much broader than insights on margins and capacity utilizations, you can get quantitative insight on DNA and culture, on how the management do things.
The example which I am going to introduce is between $VETO.PA (Vetoquinol) and $ZTS (Zoetis).
source: own calculations
Now I am going to walk you through my table and calculations:
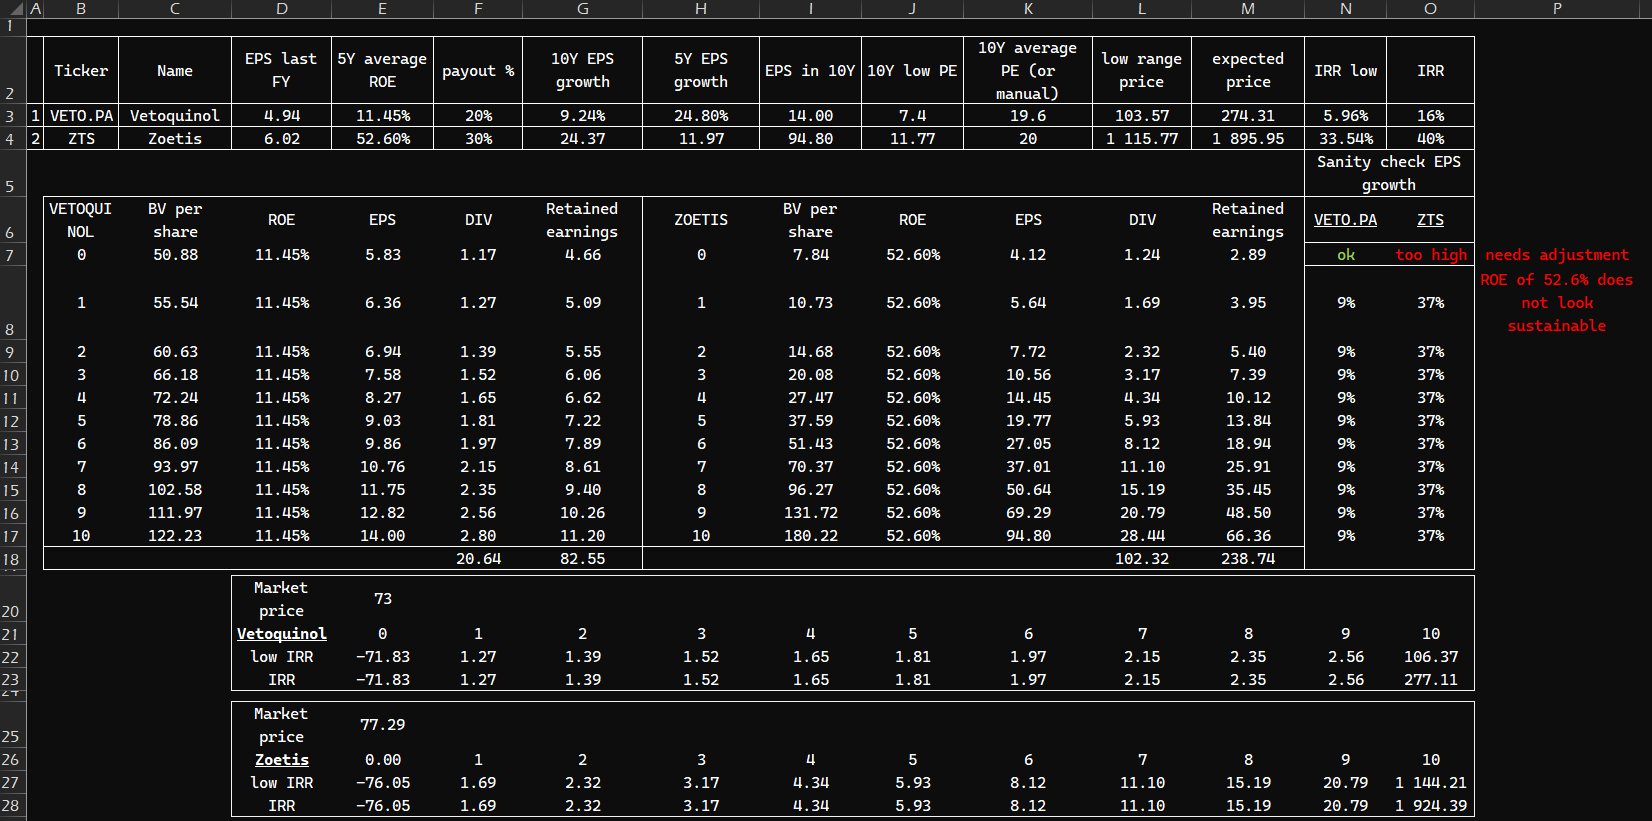
The base of this table is a quantitative forecast for the EPS in 10 years time, after that based on a low PE scenario and mean PE scenario we arrive at a forecast for the stock price in 10 years time. The EPS is based on two fundamental numbers - book value per share and ROE. We assume that reinvested capital will compound at ROE. We also fix a payout ratio and a dividend stream for the 10 years. The final step is to calculate IRR. At year 0 we have a negative outflow for buying a share plus the dividend for the year. Then you receive the dividend flow each year and at year 10 you sell the share at the forecasted price plus the dividend received. Based on those cash flow streams you arrive at approximation for IRR - annual rate of return.
Results for Vetoquinol:
The key assumptions are:
ROE 11.45% (5Y average)
payout ratio 20%
low PE scenario 7.4x (10Y lowest PE)
Mean PE scenario 19.6x
We get IRR for the pessimistic scenario of 5.96% annually and 16% annual return for the mean PE scenario.
So I can conclude that the expected return for holding $VETO.PA for 10 years is between 6% and 16% annually.
Always do a sanity check. Earnings per share growth is at 9% for a 10 year period which is realistic for that particular business in that particular industry.
Results for Zoetis:
ROE 52.60% (5Y average) - at first sight I can see that there is financial engineering into that number. Leverage is the black magic of finance.
payout ratio 30%
low PE 11.77x (10Y lowest PE)
Mean PE scenario 20x (I put that number manually based on common sense). For the last 10 years the mean PE is 37x which is against common sense.
When mathematically going through the calculations we get IRR for the pessimistic scenario of 33.54% annually and IRR of 40% for the mean PE scenario. Those are huge expected returns in the too good to be true pile. As I mentioned above we will need to dig deeper into the debris of finance black magic.
Sanity check:
EPS growth of 37% per annum for the next 10 years is not a story one can buy easily. The source of these rosy numbers is the ROE of 52.6%.
Decomposing ROE:
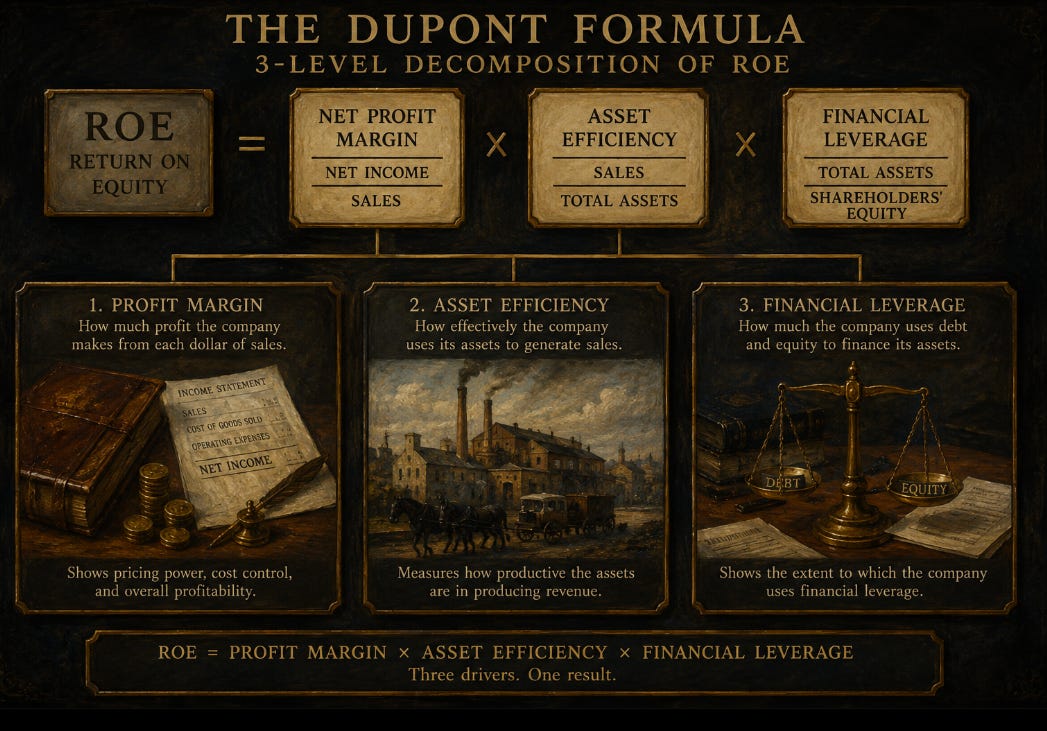
source: own calculations
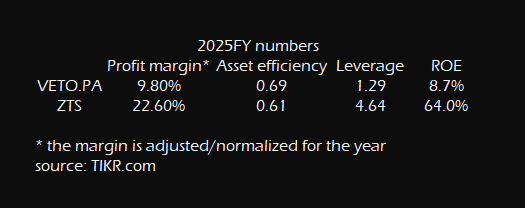
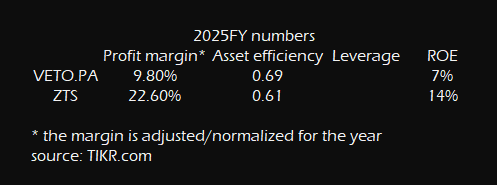
Looking at the FY2025 numbers (used them from TIKR.com) I can draw several conclusions:
ZTS is much more profitable than VETO.PA and this is expected. Two sources for this superior profitability:
Scale - Zoetis is a huge player and scale brings costs down
US market represents more than 50% of Zoetis sales while US represents around 20% for Vetoquinol. US sales prices are one of the highest for animal products, meaning a higher margin market.
Asset efficiency is quite similar but better for Vetoquinol. Making more sales per monetary unit invested in assets.
And leverage turns out to be the biggest differentiator. Leverage is 1.29x for VETO.PA compared to 4.64x for ZTS, quite a gap. But that gap is not what it appears to be, and I will come back to it. We start with accounting numbers and then we will move toward value economics.
What is the source of ZTS 0.00%↑ leveraged position? It is the buybacks:
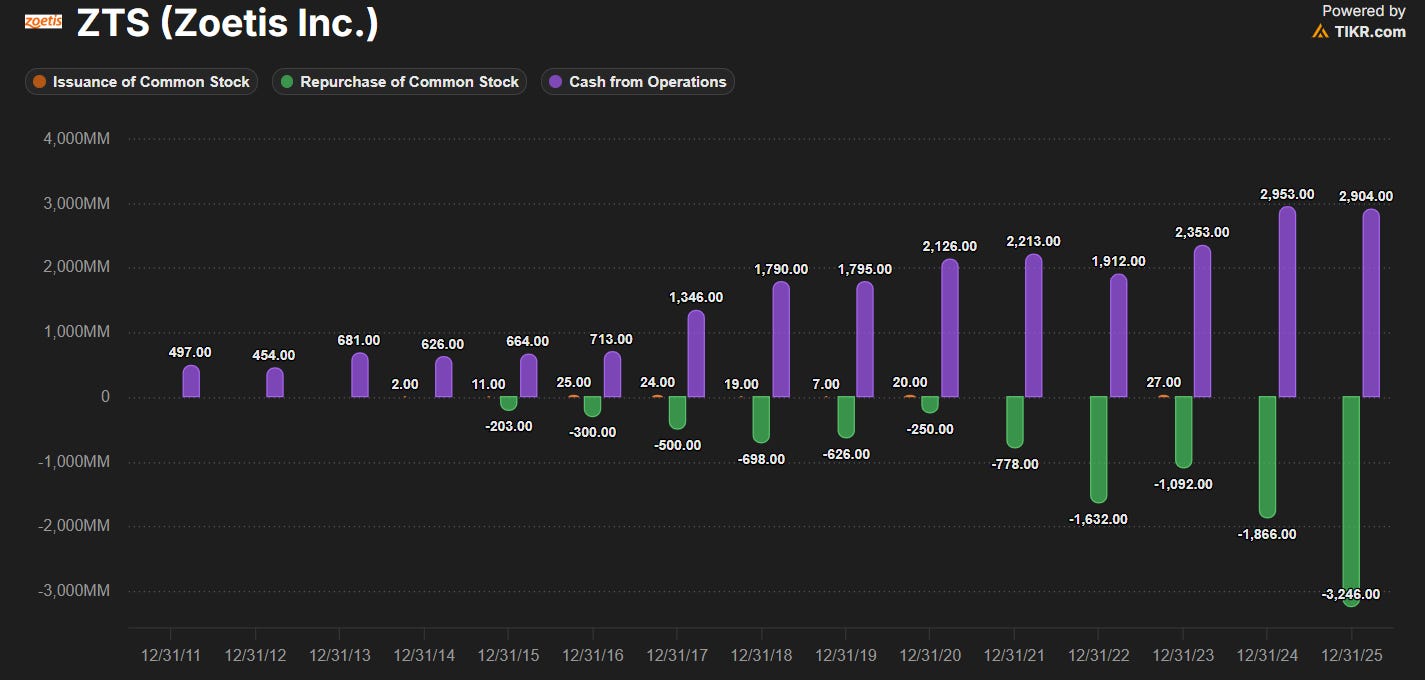
We can see that in 2025 the company bought more of its own shares for $3.2 billion USD, that is more than the CFO of $2.9 billion USD for 2025. The company is taking debt to buyback shares. That is quite an aggressive move, a move directed at the stock price not at long-term value creation. Taking on additional debt to distribute dividends or to buy back shares is a speculative, financial move at the ever hungry wall street beast.
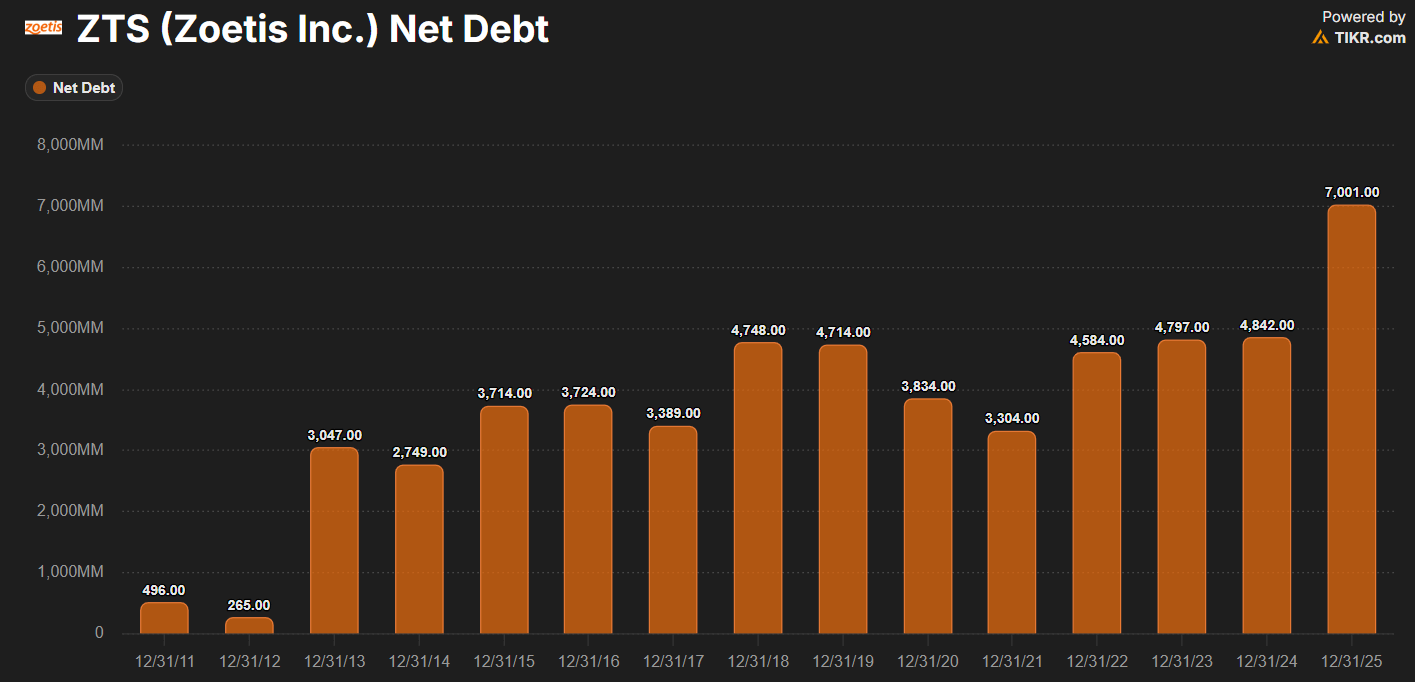
In 2025 the company increased its net debt position by ~ $2.2 billion USD or approximately 70% of the buybacks. Looking at the chart above I can conclude that the company is systematically buying back shares regardless of the price. Perhaps in 2025 when finally the price is in the fair value - undervalued territory the management is buying with additional debt.
Zoetis's treasury stock stands at 76,963,708 shares acquired for $10,7 billion USD — an average cost of roughly $139 per share. The stock closed on 31 July at $77.29. The company's treasury book is underwater by something like 44%, call it $4.7 billion USD of shareholder capital destroyed by repurchase timing.
So when I look at the books and see a leverage ratio of 4.64x I don’t see a solvency problem because it is rooted in accounting. It is not debt — it is $10.7bn of treasury stock sitting as a contra-equity account after a decade of buybacks.
I see a philosophical problem. I see management trying its best to optimize for EPS and destroying $4.7 billion USD of shareholders value in the process. Ill-timed buybacks above intrinsic value are only the symptom; the root cause is the incentives.
Let’s strip the leverage effect to see what we get:
source: own calculations
So the difference of ROE is 2x, not 7x like in the accounting case. That is the honest gap in underlying profitability — roughly two-fold.
The only real comparative advantage of ZTS over VETO.PA is scale and the higher exposure to the US market (which can also be seen as greater concentration risk, but this is another story).
The common sense is that given the same growth prospects ZTS should be valued by Mr. Market 2x higher than VETO.PA.
But let’s see what Mr. Market is quoting for the shares of these two competing businesses. One owned and operated by the Frechin Family (67% ownership), the other owned by Wall Street and operated by hired-gun management.
The best metric to look for the contribution of profit margin is the P/S ratio.
Fundamental P/S ratio = net profit margin*(Payout ratio*(1+g)/(k-g))
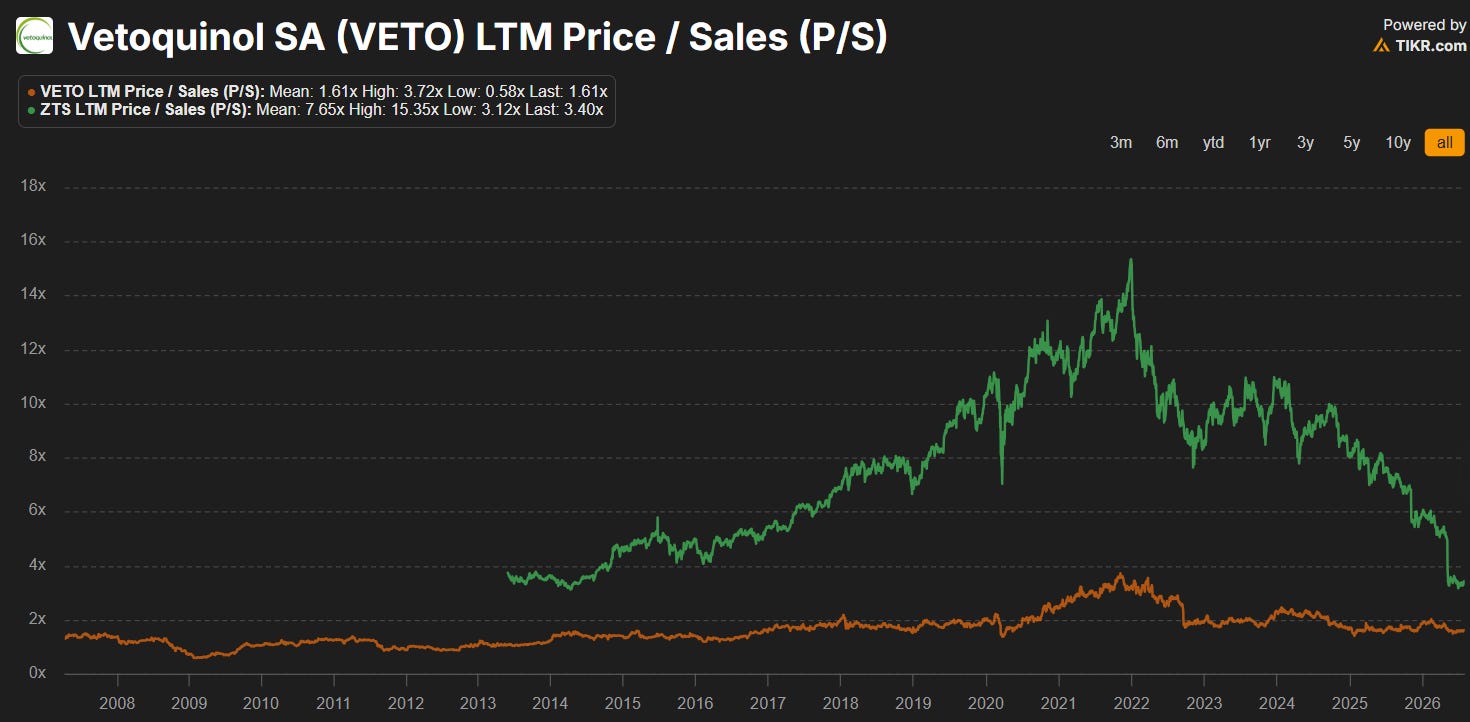
Mr. Market is pricing the equity of Zoetis at 3.4x sales while it is pricing the equity of Vetoquinol 1.61x sales. The multiple is 2.11x higher - so very close to what I stated above, that the fundamental gap between the two businesses can explain a 2x higher valuation for Zoetis.
So my main thesis is not a relative-value argument but a capital-allocation argument, and I will accept a lower expected return on an Excel spreadsheet for the more prudent and enduring way of making capital allocation decisions.
Finally let’s look at the stock price:
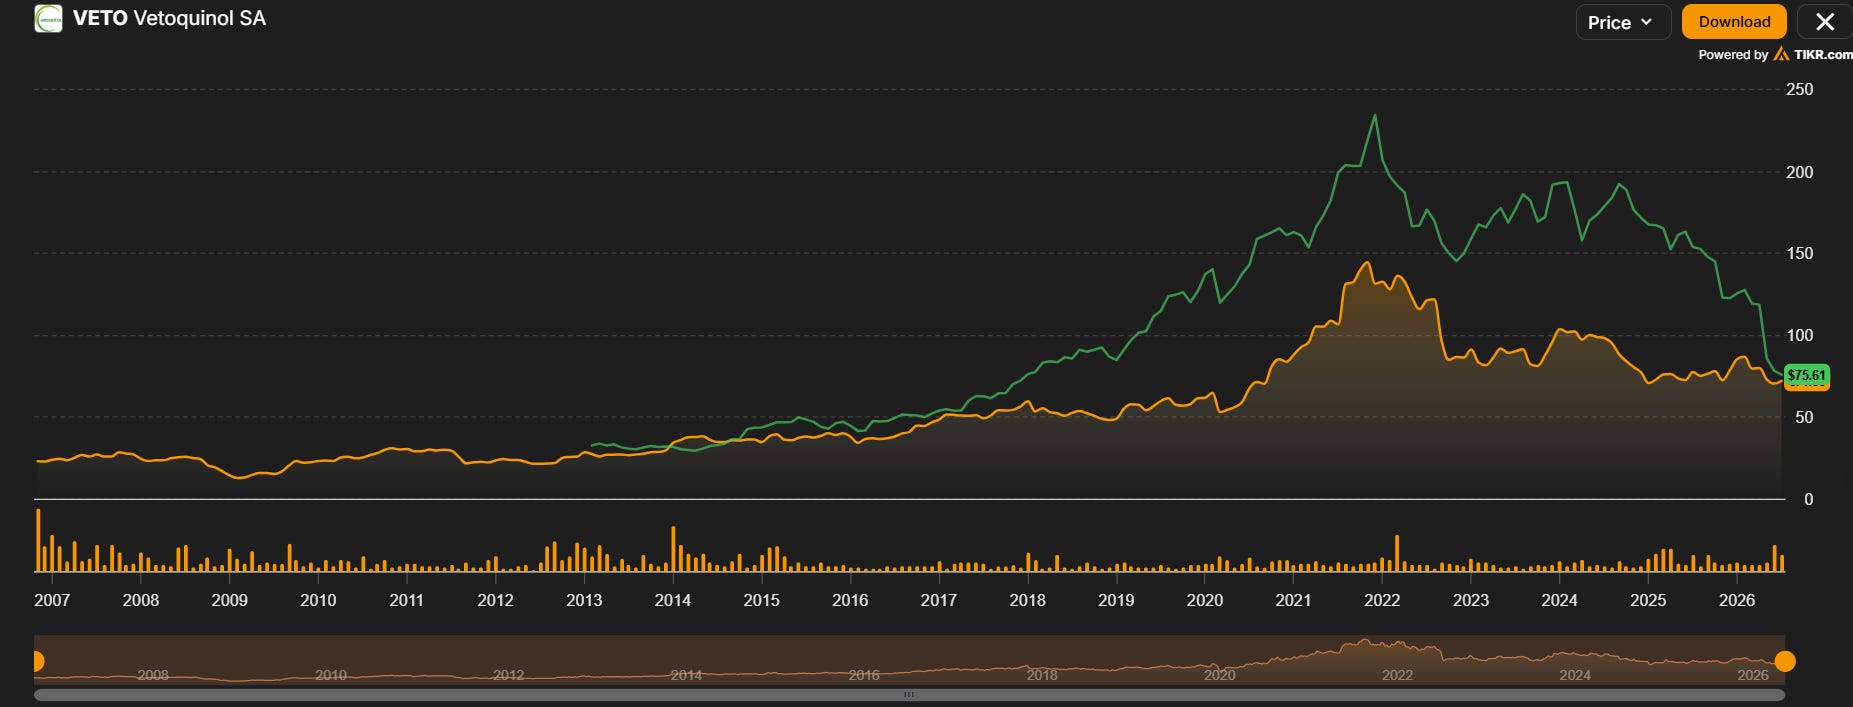
Zoetis as a wall street creature is overperforming on the upside and underperforming on the downside. For the very long-term returns converge. During booms money flows, index funds, liquidity are external stimulus which lead to overvaluation through multiple expansion. During downturns the way to fundamentals is painful because what pushed prices higher was speculative capital. Liquidity can disappear, trends on the street can change quickly and when fear kicks in there is no one to take the pieces.
In the case of Vetoquinol there is a controlling shareholder also involved in the management of the business. The strategy is more conservative, the capital structure is designed for longevity and endurance not for stock price outperformance or for beating the quarterly EPS. During downturns the family ownership can be the anchor which will guide the business through the storm lightening the path to long-term value creation.
How both companies used CFO (cash flow from operations):
For the period FY2021 - FY2025 I will look at the cumulative capital allocation figures to gain some more insight.
$VETO.PA:
source: own calculations
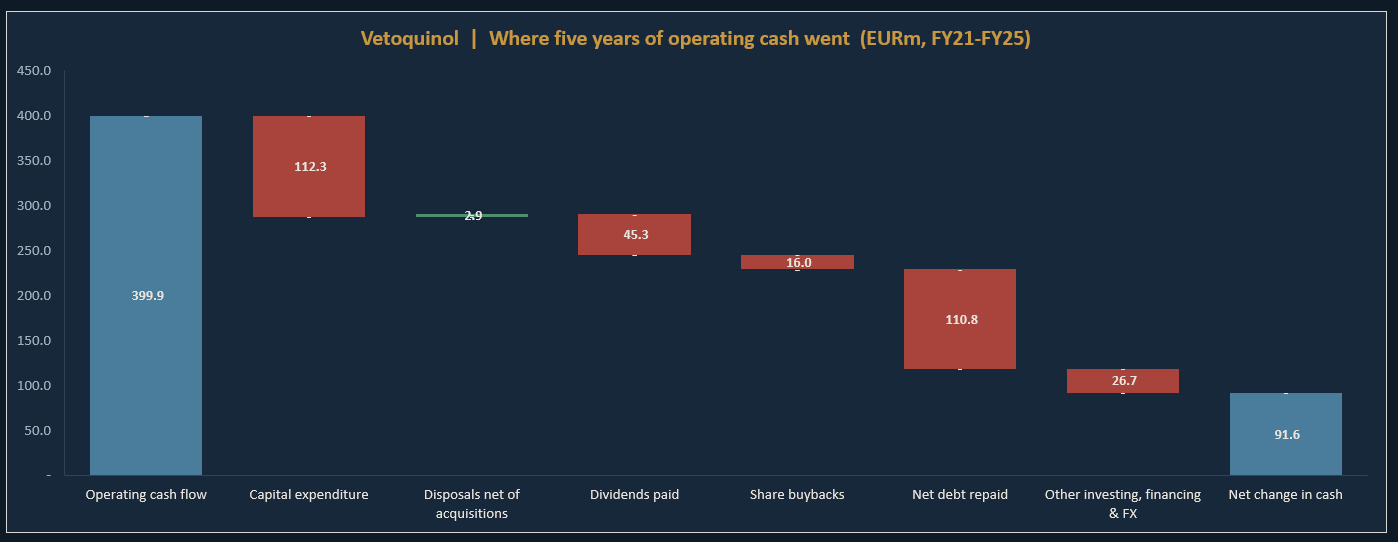
For five years the company generated ~ 400 million euro in CFO. The company invested 28% of that cash flow into the business; 11% of those cash flows distributed as dividends; ~ 28% used for debt reduction. Net cash increased by 91.6 million euro for the 5 year period. This is how prudent capital allocation looks in my book.
$ZTS:
source: own calculations
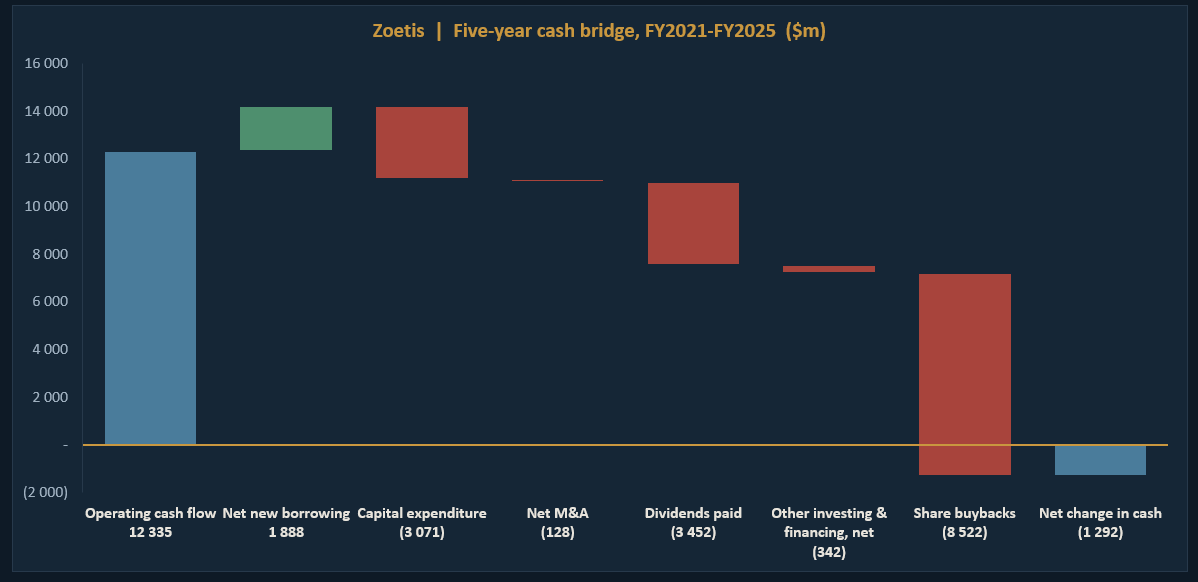
For the five year period Zoetis generated 12.3 billion USD cash flow from operations. Almost 97% of it was used for 8.5 billion USD share buybacks and 3.45 billion USD dividends. The CAPEX was for ~ 3 billion USD - the company increased borrowing by ~ 1.9 billion USD and decreased cash position by ~ 1.3 billion USD.
Comparison:
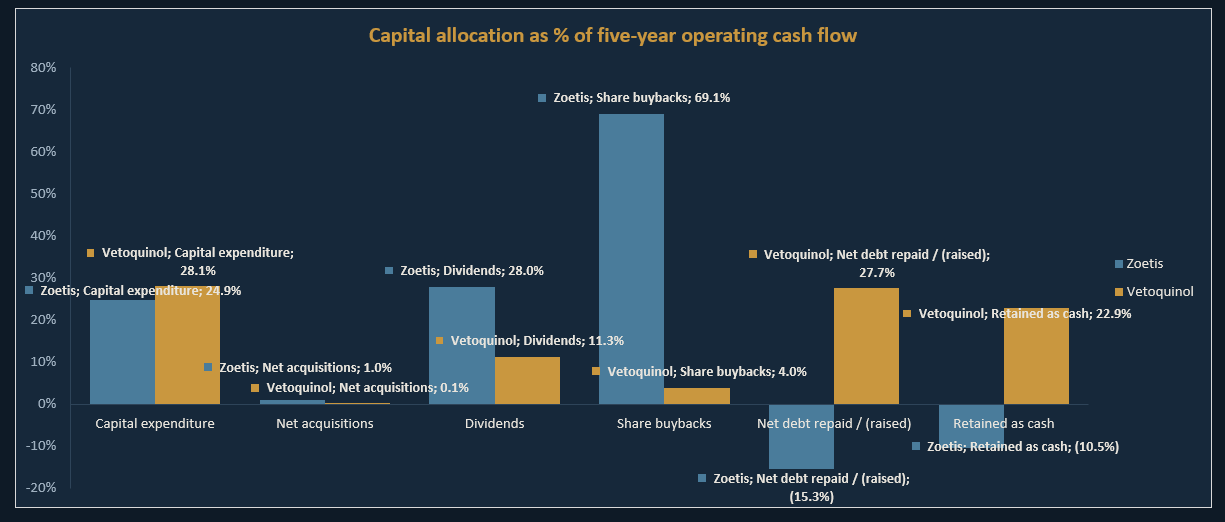
I think this is the chart that shows how different an owner runs his business and how a management team runs a business owned by wall street.
The owner used the generated cash flow to strengthen the business’ financial position. Used 28% of it to reduce debt and increased the cash position with 23% of it. The rest was used for CAPEX 28% and distribution to shareholders 15% (11.3% dividends + 4% buybacks).
The management team of Zoetis used 97% of the generated cash flows for the 5 year period to distribute back to shareholders. Used additional debt and reduced cash to cover for CAPEX.
Restating IRR for ZTS - adjusting for treasury shares
For the ROE adjustment I will use the adjusted ROE for FY2025.
Four steps, all from the FY2025 balance sheet:
1. Reported common equity — $3 331m
2. Add back treasury stock at cost — $10 685m (76 963 708 shares)
3. Adjusted common equity — $14 016m
4. Adjusted ROE = FY2025 net income of $2 700m ÷ $14 016m = 19.3%
Paired with adjusted BVPS of $14,016m ÷ 424.9m shares = $32.99.
source: own calculations
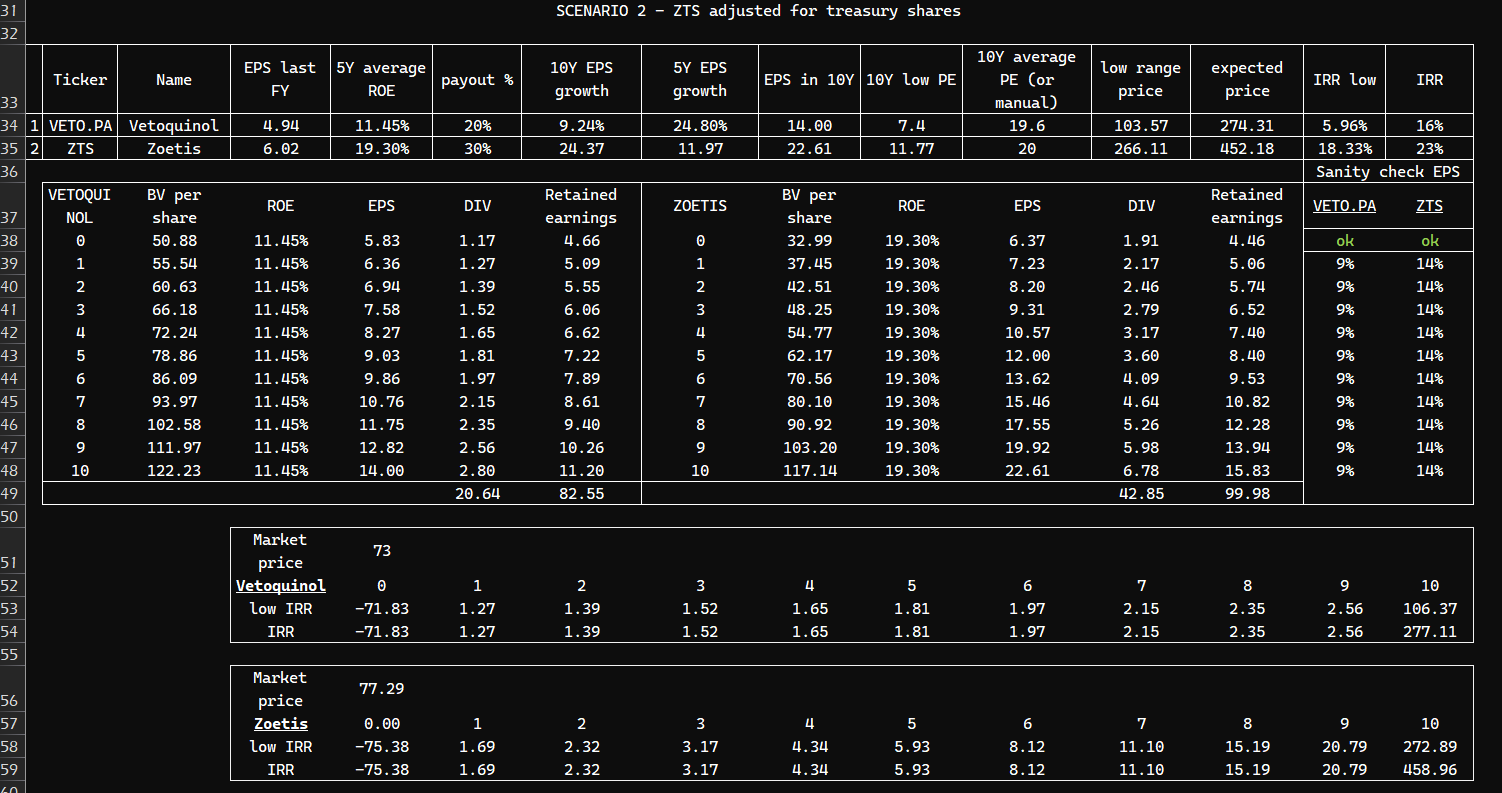
When the ZTS numbers are adjusted for the treasury shares —> increased equity and decreased ROE we arrive at a more realistic scenario. The sanity check is showing 14% annual EPS growth which is still stretched but sane.
The expected annual returns for ZTS are in the 18% to 23% range much higher than the expected returns on VETO.PA.
CONCLUSION:
The industry is facing some long term structural tail winds
The main industry risk is regulatory.
I like both companies at these levels but one is strategic and the other is tactical.
For a long term holding I will choose $VETO.PA - I own the stock and plan to accumulate from time to time. This is a French mid cap ~850 million euro market cap; ~640 million euro EV (enterprise value), building quietly away from the spotlights. With a cash position providing for optionality. I am ready to take the lower expected returns for the much sounder capital allocation philosophy which increases the probability for longevity and endurance.
ZTS can be a good recovery story / tactical position for short term gains. This is a ~ 32 billion USD market cap monster, a useful parking spot for the Vanguards and Black Rocks of the world - currently on my watchlist for a potential tactical play. Expected returns from a quantitative perspective are very attractive, the philosophy behind capital allocation decisions is not.
If you found this valuable, consider becoming a subscriber. Your support helps sustain this work. Thank you - and Godspeed.
Disclosure:
The views expressed in this analysis are my own and are provided for informational purposes only. This content does not constitute investment advice, a recommendation, or an offer to buy or sell any securities. I may have a financial interest in the companies discussed. Always conduct your own due diligence or consult a registered financial advisor before making investment decisions.